MIYOQA / Engines
Calculation engines, one standard of evidence.
Statistical process control, capability, measurement systems, risk, geometry and process flow. Each engine is versioned, and each result is kept with its inputs.
Calculation engines
Statistics you can defend in an audit.
Figures come from named, versioned engines that follow published reference methods, and each result is kept with the record of how it was calculated.
Statistical process control
- Variables, attribute and median charts
- EWMA, CUSUM and moving average
- Hotelling T² for related characteristics
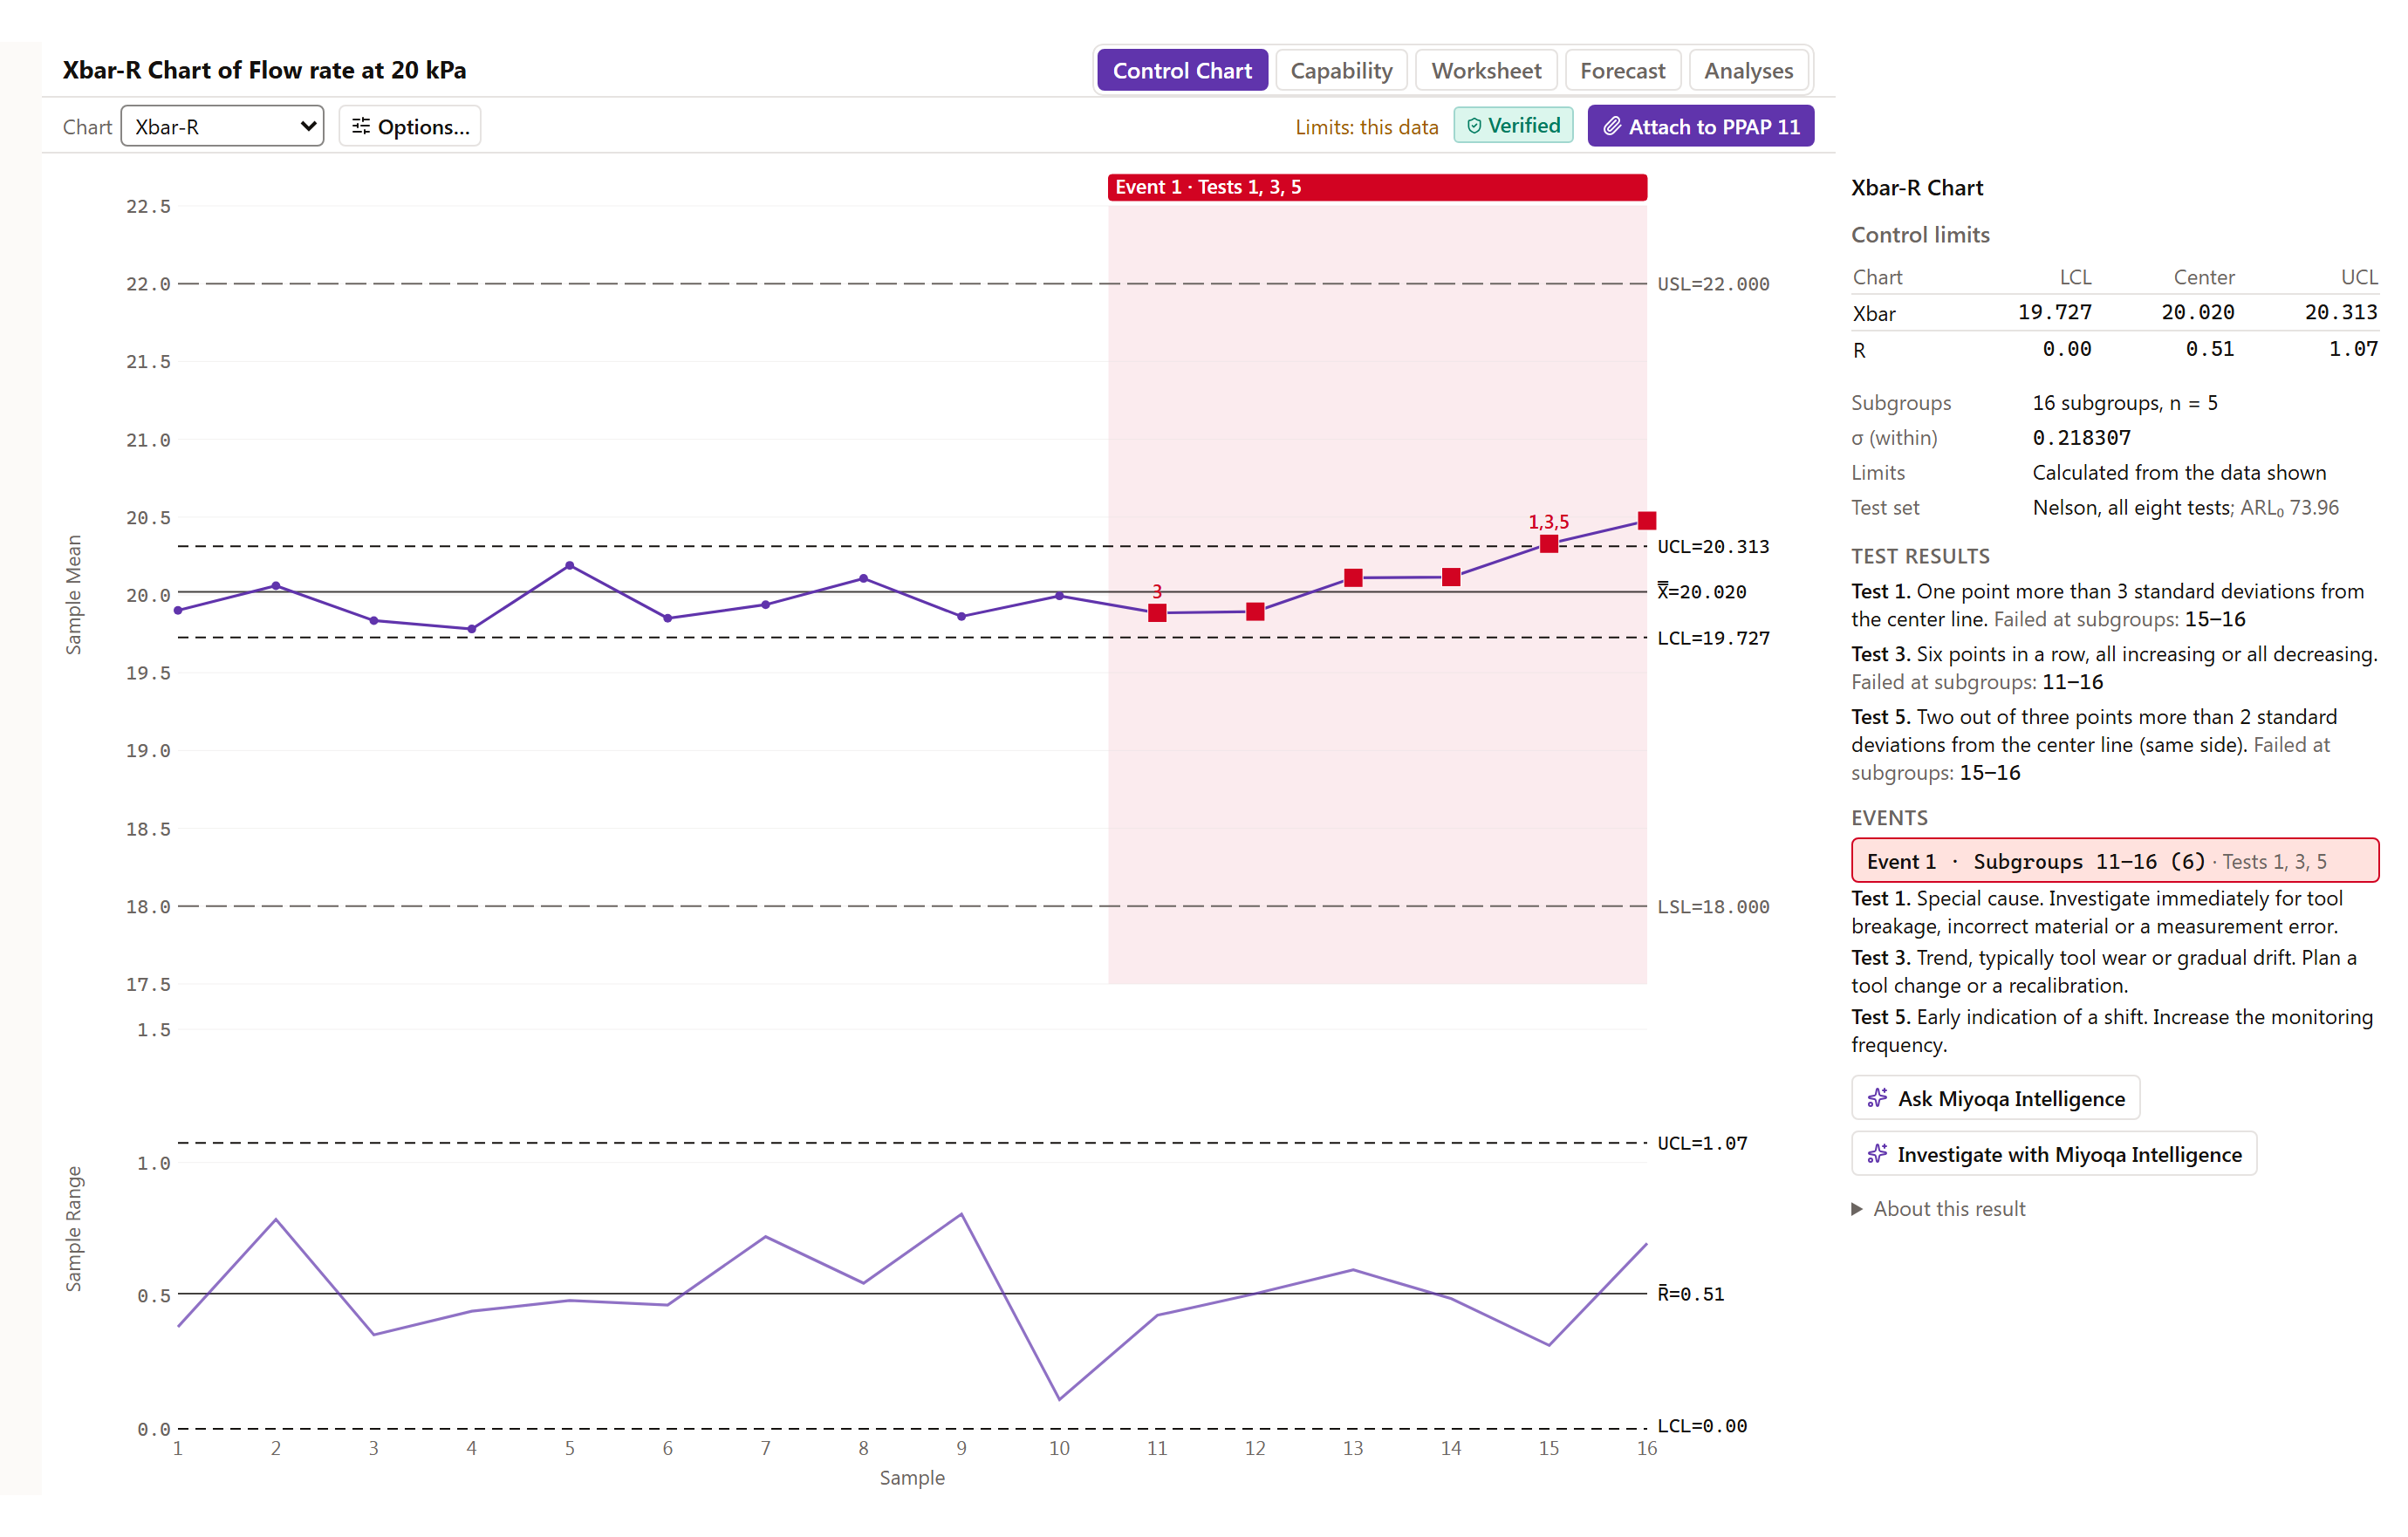
- Run rules with their expected false-alarm rate shown
- Phase I limits locked for Phase II
Capability and measurement
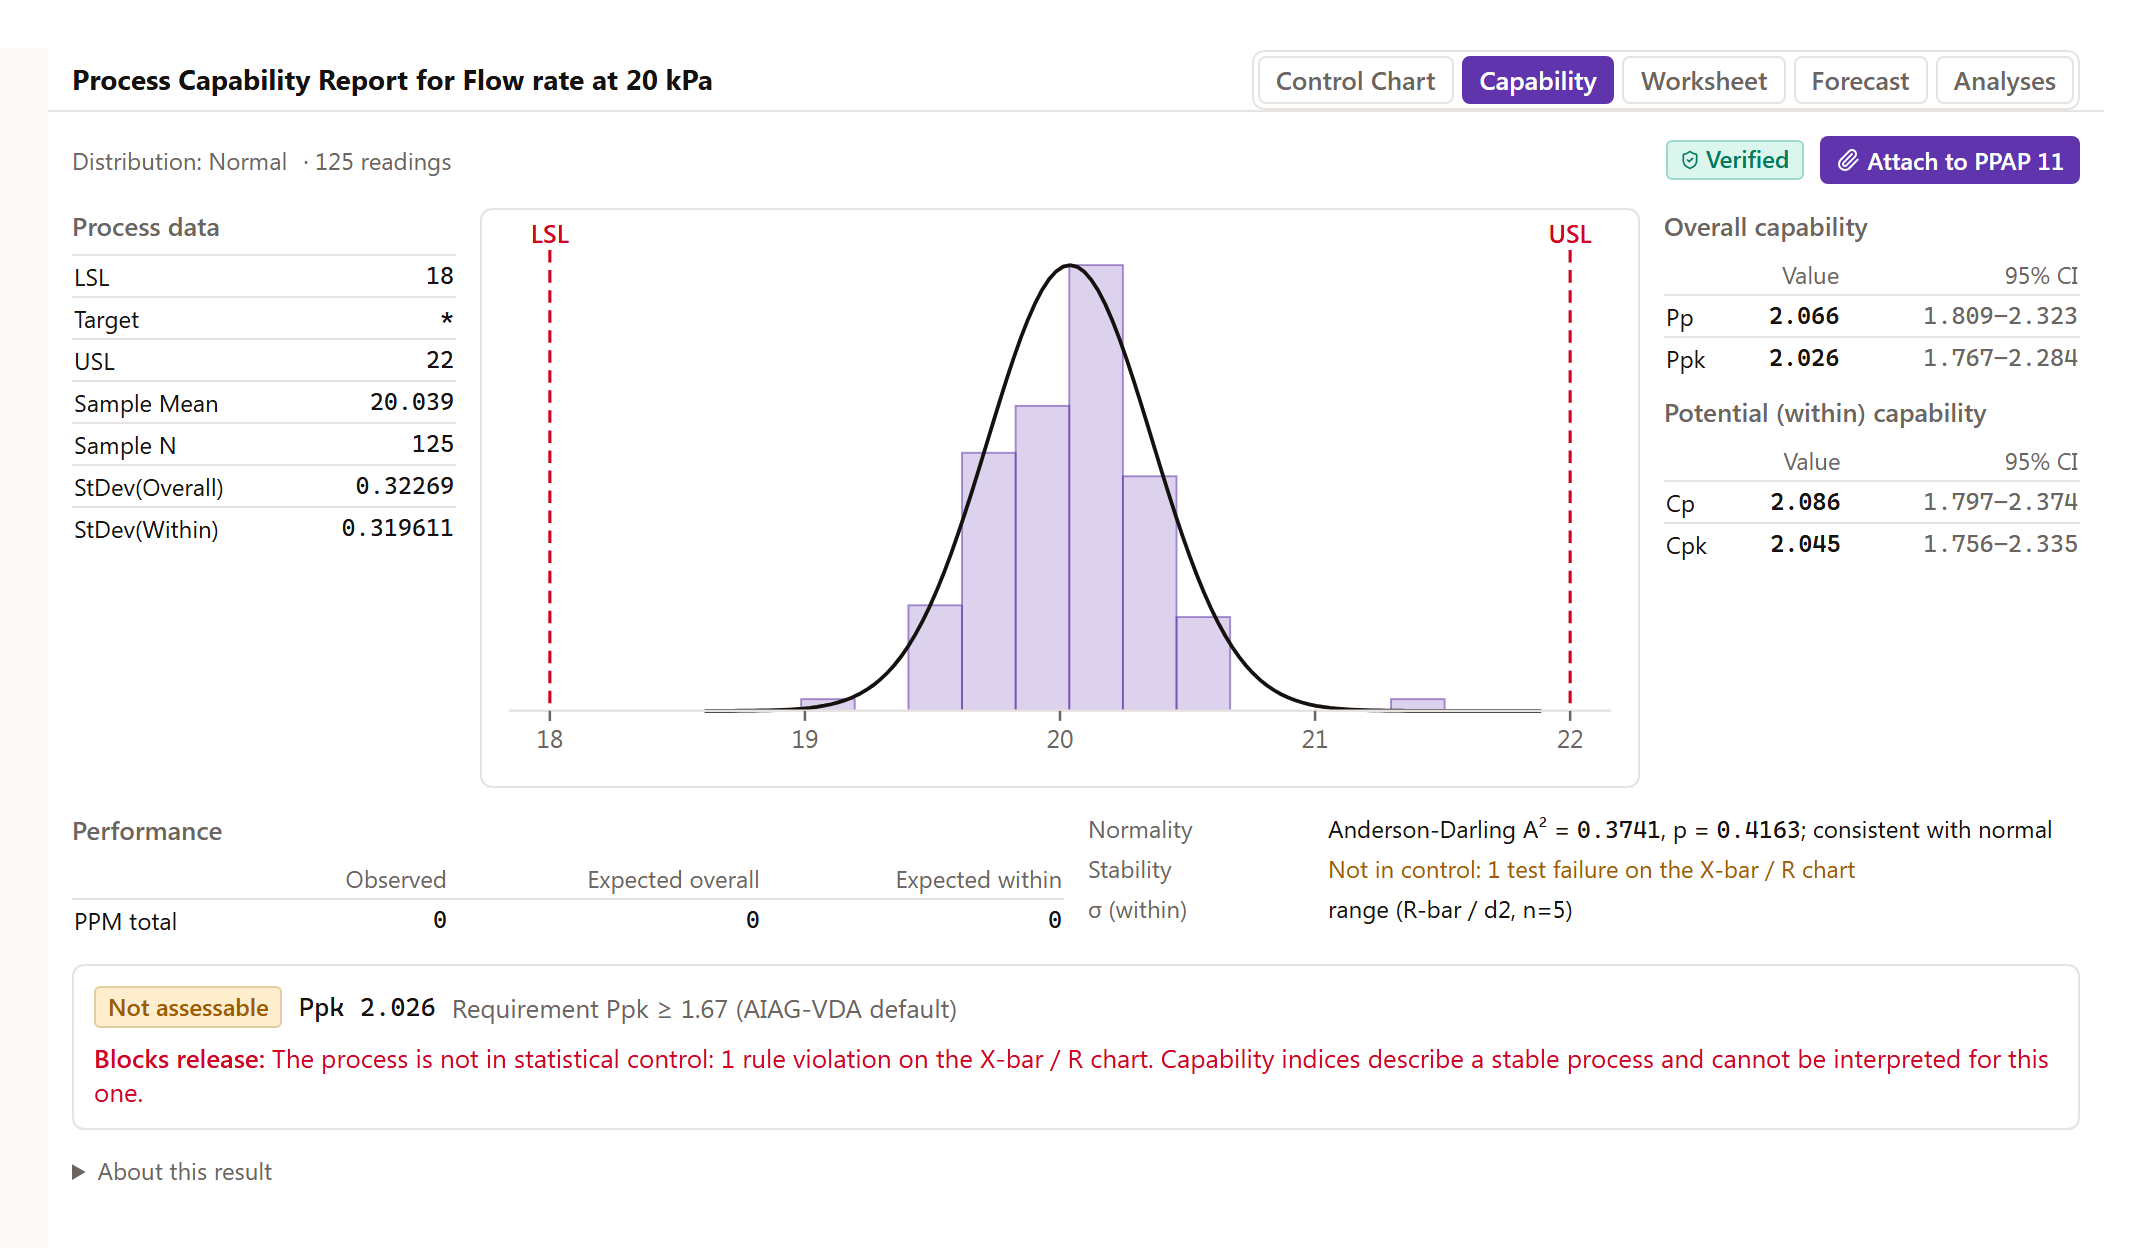
- Cp, Cpk, Pp and Ppk with confidence intervals
- Stability check before capability is reported
- Non-normal data handled, not ignored
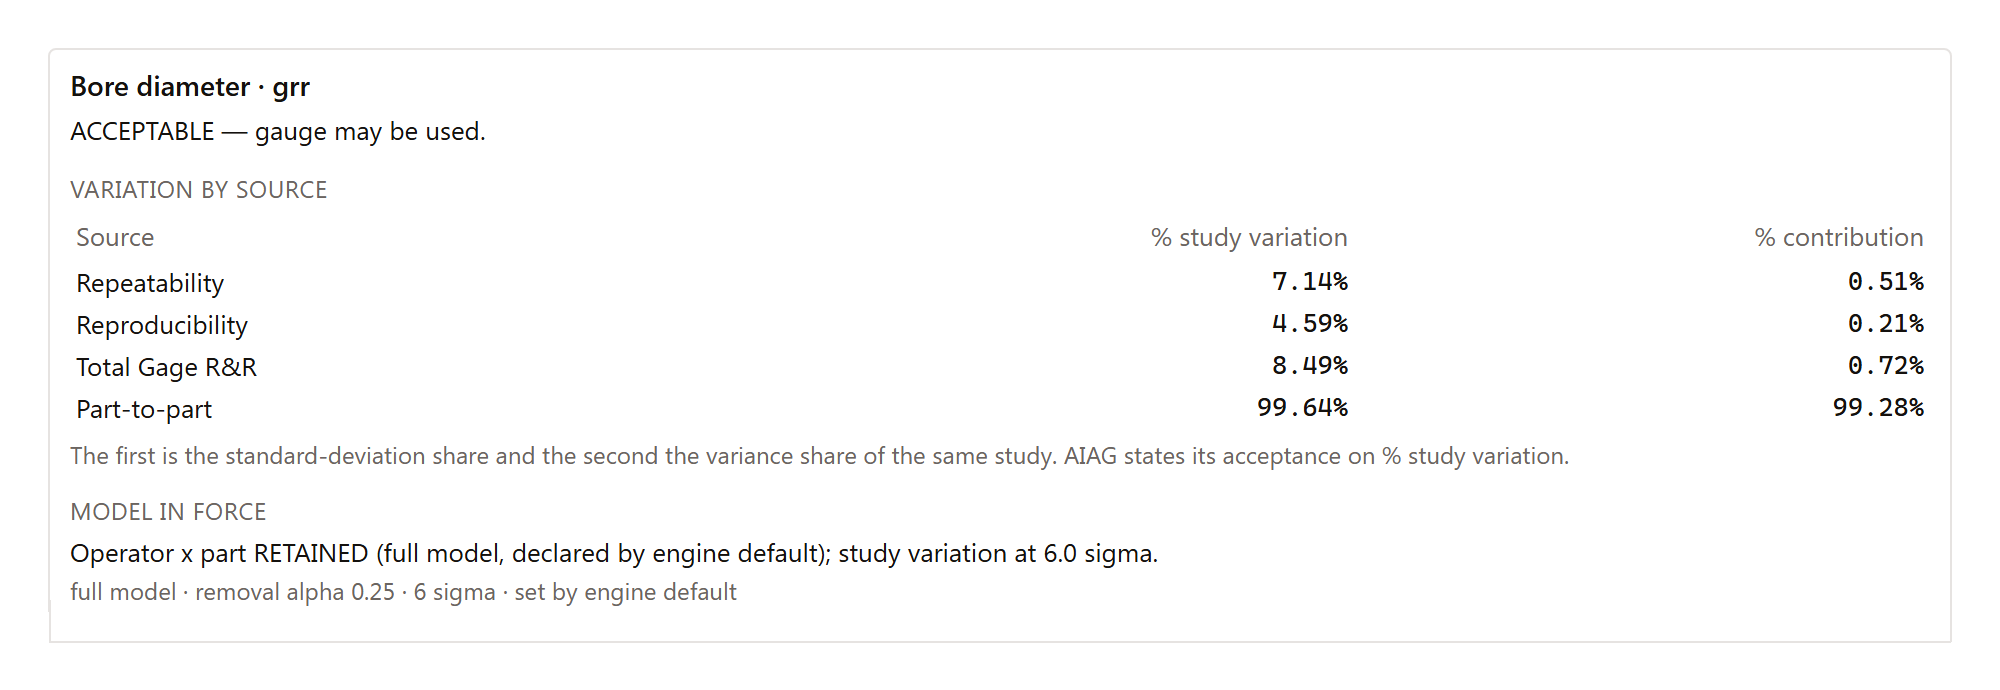
- Gauge R&R by ANOVA, AIAG MSA 4th edition
- Type 1 study, attribute agreement, uncertainty
Risk and reliability
- AIAG-VDA action priority, full table
- Fault tree with minimal cut sets
- System FMEA and FMEDA
- Weibull analysis
- Hypothesis tests, DOE and regression
Geometry and process
- True position with bonus tolerance
- Stack-up, worst case and RSS
- Monte Carlo simulation, labelled as a model
- Line balance, takt and bottleneck
- Plant layout feasibility
Kept with its inputs
Each result records the engine, its version and the exact inputs it used.
Readings never overwritten
A measurement, once recorded, is kept. A correction is a new entry.
Checked a second way
Engines can recompute a result by an independent method and flag any disagreement.
In the product
An engine reports what the data supports, and no more.
These results were calculated by MIYOQA's engines from the demonstration programme that ships with the product: an electric coolant pump, flow rate at 20 kPa, and a bore diameter gauge study.
Review your own part on MIYOQA.
Bring one part's BOM, PFMEA and control plan. We will show what is connected and what is missing.